Nepal is a landlocked country in South Asia with an estimated population of 29 million. Agriculture remains central to the economy, accounting for about 27% of gross domestic product (GDP) and employing a sizeable proportion of the workforce. However, the country also relies heavily on tourism and remittances from migrant workers abroad, which make up more than 25% of Nepal’s total GDP. Nepal has been seeking to diversify its economy through foreign direct investment (FDI) in energy, infrastructure, and services.
In 2020, Nepal’s GDP stood at US$29.3 billion. By 2021, it had increased to US$30.5 billion, partly due to post-pandemic economic recovery and continued growth in the tourism sector. Official unemployment figures in Nepal are relatively low, but underemployment remains a major issue, especially in rural areas. The country’s Gini coefficient is estimated at 0.32, indicating moderate income inequality, though rural–urban disparities still persist. Nepal’s tax system includes both direct and indirect taxes; the highest marginal rate for personal income tax is approximately 30%.
The tourism sector is vital. Trekking permits, especially for the Annapurna, Everest, and Langtang regions, represent a key source of government revenue. Due to recent changes in permit fees and fluctuations in tourism numbers, local businesses have experienced varying levels of income from trekking-related services.
Table 1: Labour market data in Nepal (2021)
Population (millions)
Labour force (millions)
Employed (millions)
Unemployed (millions)
29
16.0
15.6
0.4
Table 2: Trekking permit data for Nepal
Year
Average permit price (USD)
Number of permits sold
2021
50
150 000
2022
60
120 000
(a)
Using the information in Table 1, the official unemployment rate in Nepal for 2021.
[2]
(b)
Using the data provided in the text, Nepal’s real GDP growth rate from 2020 to 2021. Show your working.
[2]
(c)
Using information from Table 2, the price elasticity of demand for trekking permits in Nepal when the average permit price increases from US$50 to US$60.
[2]
(d)
Using information from Table 2, the change in total revenue from trekking permit sales between 2021 and 2022.
HLPaper 3
Vietnam is an emerging economy in Southeast Asia that has seen rapid industrialization over the past decade. The nation relies heavily on its manufacturing sector, which contributes significantly to its export earnings. However, certain domestic sectors, such as the heavy metals industry, have struggled to remain competitive against lower-priced imports. In 2023, the Vietnamese government considered various trade protection measures to support local steel producers who claimed that foreign firms were selling products below the cost of production in the domestic market.
Steel is a vital component for the construction and automotive industries in Vietnam. To address the surge in imports, the government implemented a trade barrier to increase the domestic price and reduce the volume of imports. While this measure was welcomed by local mill owners, representatives from the construction sector warned that increased costs for raw materials could lead to project delays and higher housing prices.
Table 1: Macroeconomic Indicators of Vietnam (2020–2023)
SL & HLPaper 2
Case Study: Germany’s Economy and Energy Transition in the Early 2020s
Germany, as Europe’s largest economy, has historically relied on its robust industrial sector, strong exports of machinery and automobiles, and high-value-added manufacturing. During the early 2020s, it faced a combination of opportunities and challenges. On the one hand, demand for German exports remained high in global markets, supported by a reputation for quality engineering. On the other hand, supply chain disruptions in semiconductors and rising energy prices, partly triggered by shifts in international energy markets and global uncertainties, weighed on industrial output.
In 2022, Germany recorded a nominal GDP of US$4.4 trillion, with real GDP growth at 1.8% a deceleration from the 2.5% reported in 2021. Average inflation rose to 7.5% in 2022, up from 3.2% the previous year. Some macroeconomists attributed this spike in inflation to a combination of higher global commodity prices, labor shortages, and an expansionary fiscal stance aimed at countering pandemic-related slowdowns. In addition, rising household disposable incomes contributed to higher consumer spending, adding demand-side pressure on the price level. The government’s budget deficit reached 3.8% of GDP in 2022, spurred by increased health expenditures and targeted subsidies for certain industries, especially those transitioning to greener production methods.
A core focus of German policy has been the energy transition (“Energiewende”), which aims to phase out nuclear power while boosting renewable energy sources such as wind and solar. The government introduced new subsidies for households installing solar panels and for firms adopting more energy-efficient processes. Although these measures have helped reduce emissions, critics argue they impose higher short-term production costs on businesses. In 2022, approximately 46% of Germany’s electricity came from renewables, illustrating a notable increase compared to 35% five years earlier. Nevertheless, some economists worry about energy security, cautioning that reliance on imported natural gas may expose the economy to price volatility.
SL & HLPaper 1
(a)
how income inequality can affect economic growth, using an appropriate diagram where relevant (for example, a Lorenz curve and/or an aggregate demand mechanism).
[10]
(b)
Using real-world examples, the view that income and wealth inequalities have negative effects on economic growth.
[15]
SL & HLPaper 2
Recent Economic Trends in Chile
Chile, located along the western coast of South America, is widely regarded as one of the region’s most stable and prosperous nations. With a population of around 19 million, the country boasts a successful track record in macroeconomic management, marked by consistent economic growth and relatively low government debt levels. However, ongoing shifts in global trade, fluctuating copper prices, and recent policy reforms have brought new challenges to Chile’s economy.
In 2022, Chile recorded an average monthly wage of approximately US$600, though the cost of living in major urban centers such as Santiago continues to rise. To maintain price stability, the Central Bank of Chile has long operated an inflation-targeting regime, typically aiming for annual inflation close to 3%. Yet external pressures—like disruptions to global supply chains—pushed the inflation rate up to 7.2% in 2022. Unemployment remains a pressing issue; following a peak of 10.7% in 2020 when economic activity contracted, joblessness has gradually declined as the economy recovers.
Chile’s economic identity is strongly tied to mining, particularly copper, which accounts for a significant proportion of export revenues. In 2022, approximately 45% of total exports came from copper and other minerals. While copper has been a major driver of economic growth, economists and policymakers increasingly emphasize diversification to protect against commodity price volatility. The government has also expanded support for agricultural and service industries, promoting increased global competitiveness through various trade agreements with North American and Asian partners.
On the fiscal side, Chile historically prided itself on low government debt, yet debt levels have slowly risen to 37% of GDP by 2022. This reflects higher spending on social programs, including public healthcare and education subsidies. Policymakers are attempting to strike a balance between prudent fiscal management and ensuring equitable access to basic services. In the microeconomic arena, Chile introduced an excise tax on sugar-sweetened beverages to discourage unhealthy consumption and reduce negative externalities tied to rising obesity rates.
IB Economics Topic 3.4 Economics of Inequality and Poverty Questionbank
Practice IB Economics Topic 3.4 Economics of Inequality and Poverty with authentic exam-style questions for both SL and HL students. This question bank focuses on the exact syllabus content for 3.4 Economics of Inequality and Poverty and mirrors Paper 1, 2, 3 style where relevant.
Get instant solutions, detailed explanations, and build confidence with questions aligned to IB examiner expectations.
Using the text/data provided and your knowledge of economics, recommend a policy which could be implemented by the government of Nepal in order to promote sustainable economic growth.
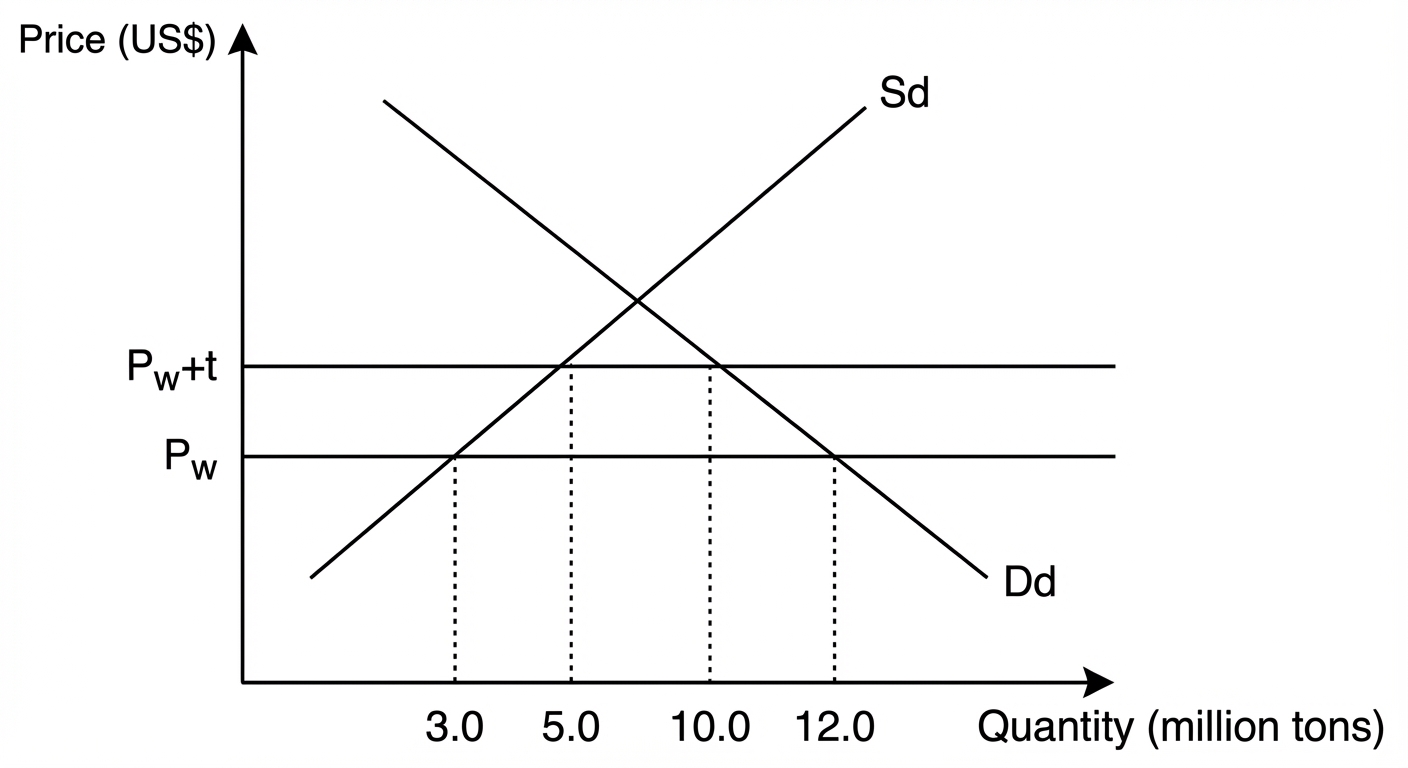
Using the information in Table 3, the reduction in the volume of imported steel (in millions of tons) that occurred after the implementation of the tariff.
Using the data in Table 3, the change in total consumer expenditure on steel (in US$ millions) when the price rises from $400 to $450.
[2]
(e)
the term “ad valorem tariff.”
[2]
(f)
Using the diagram in Figure 1, how the imposition of the tariff affects the surplus of domestic steel producers and the efficiency of resource allocation in Vietnam.
[4]
(g)
Using the information in Table 3, the change in total revenue for domestic steel producers (in US$ millions) resulting from the tariff.
[2]
(h)
two possible negative impacts of protecting the steel industry on other sectors of the Vietnamese economy.
[4]
(i)
Using the provided information and your knowledge of economics, the decision of the Vietnamese government to impose a tariff on imported steel. your response.
[10]
In microeconomic terms, the government has also promoted a minimum wage policy to address income inequality and stimulate productivity within the service sector. In 2021, the minimum wage was increased by almost 10%, affecting over 4 million workers. Critics claim that small businesses may struggle with higher labor costs, while proponents emphasize that increased household income boosts consumption. Moreover, with Germany’s aging population, policymakers have launched campaigns to attract high-skilled migrant labor to fill gaps in advanced manufacturing and technological innovation.
Internationally, Germany’s trade relationships with European Union partners remain pivotal. Its exporters benefit from lower intra-EU trade barriers, and the euro acts as a common currency among 20 member states. However, some German manufacturers report that demand is influenced by exchange rate fluctuations with non-eurozone trading partners, particularly the United States and China. Before 2022, the euro experienced periods of depreciation against the U.S. dollar, making German exports more competitive globally.
With sustainability goals on the horizon, Germany has advanced plans to tax carbon-intensive production and invest in green infrastructure. Early results suggest an uptick in purchases of electric vehicles (EVs). A government-backed EV subsidy, set at €4,500 per vehicle, significantly lowered the price for consumers and led to a 30% increase in EV registrations from 2021 to 2022. Automotive firms quickly adapted supply chains to meet demand, though rising lithium and battery costs introduced uncertainties. In parallel, the government occasionally intervenes in energy markets to stabilize electricity prices and support households facing higher utility bills.
Many German economists expect moderate growth prospects in the coming years but emphasize caution due to potential external shocks such as geopolitical tensions and global financial volatility. The labor market, historically strong with an unemployment rate around 5.3% in 2022, could see pressure if foreign demand weakens. Nevertheless, policymakers remain focused on balancing green initiatives, fiscal prudence, and social welfare reforms. Their strategy includes maintaining Germany’s status as a leading export-driven economy, advancing climate objectives, and sustaining social protections.
an AD/AS diagram to show how higher consumer spending, prompted by rising household incomes, might affect the price level (inflation).
[3]
(e)
Using a labour market diagram, how the increase in Germany’s minimum wage could affect employment and wage levels for low-skilled workers.
[4]
(f)
Using an exchange rate diagram, how a depreciation of the euro against the U.S. dollar could affect the competitiveness of German exports.
[4]
(g)
Using a Lorenz curve diagram, how raising the minimum wage may influence income inequality within Germany.
[4]
(h)
Using an externalities diagram, how reliance on imported natural gas could lead to market failure if environmental costs are not accounted for.
[4]
(i)
Using the stimulus (especially Table 2) and your economic knowledge, the potential impact of Germany’s transition to renewable energy on its economic growth and environmental objectives.
[15]
Foreign direct investment (FDI) flows remain relatively stable in non-mining ventures, particularly in renewable energy sectors such as solar and wind. The government has enacted regulatory changes that encourage private-sector participation in green investments, hoping to lessen reliance on fossil fuels. Analysts predict that over the next decade, renewable energy might comprise up to 30% of Chile’s energy mix, helping the country manage environmental externalities while sustaining long-term economic growth.
Despite Chile’s liberalized trade regime, some domestic industries face competitiveness hurdles from global market fluctuations. The peso’s exchange rate is influenced by copper prices. Therefore, this has spurred officials to pursue greater diversification.
Income distribution remains a topic of debate. Chile has recorded improvements in its Gini coefficient over the past decade, yet inequalities persist—especially in rural areas where access to education and healthcare lags behind that in urban regions. Government initiatives to raise the minimum wage and invest in vocational training signal attempts to address income disparities, which some critics argue need more comprehensive policies.
Private enterprise plays a central role in Chile’s leading export industries. In the mining sector, large multinational firms partner with domestic companies, creating jobs and contributing to government revenue. Nevertheless, critics point to environmental costs from mining activities and the need for stricter regulations to ensure sustainable resource use. Many also question whether enough investments are being channeled into non-traditional sectors like technology and advanced manufacturing—areas widely seen as key to sustainable future growth.
Moving forward, Chile’s policy landscape continues to evolve. Discussions about strengthening social safety nets, investing further in green energy, and maintaining a competitive exchange rate occupy center stage. The government’s approach to promoting inclusive development includes balancing social spending with structural reforms that attract both domestic and foreign investors. Ultimately, Chile’s ability to diversify its economy beyond copper and ensure equity across various regions will determine its long-term path to stable and inclusive growth.
an AD/AS diagram to show how a decrease in real GDP growth might initially affect the level of unemployment.
[3]
(e)
Using a demand and supply diagram, how the excise tax on sugar-sweetened beverages might reduce the consumption of these goods in Chile (Paragraph 4).
[4]
(f)
Using an exchange rate diagram, how a decline in copper exports could affect the value of the Chilean peso (Paragraph 6).
[4]
(g)
Using a Lorenz curve diagram, how Chile’s rising average monthly wage could affect its income distribution over time (Paragraph 2).
[4]
(h)
Using a business cycle diagram, how Chile’s rebound in real GDP growth in 2021 might influence cyclical unemployment (Table 1).
[4]
(i)
Using information from the text/data and knowledge of economics, the impact of Chile’s private mining sector on the country’s long-term economic growth and development prospects.