Question
View answerSL & HLPaper 1
(a)[10]Sign up to write and grade your answer
With the aid of a correctly labelled demand and supply diagram for an import quota, how import quotas lead to reduced consumer welfare.
With the aid of a correctly labelled demand and supply diagram for an import quota, how import quotas lead to reduced consumer welfare.
Zambia is a landlocked country in south-central Africa with an estimated population of million. Over the past decade, Zambia’s economy has experienced moderate growth driven largely by copper exports, which account for nearly of the country’s total export earnings. However, frequent fluctuations in global commodity prices have resulted in volatile export revenues. In , the Zambian kwacha depreciated by nearly , trading at around ZMW per US dollar, raising concerns over inflation and the cost of imported goods.
Yemen, located at the southwestern tip of the Arabian Peninsula, has faced persistent economic and social difficulties in recent years. A combination of political instability, conflict, and a limited industrial base has significantly impacted its GDP and standard of living. Inflation rates have remained high, hovering around 28% in 2021 compared to 15% in 2019, partly because the Yemeni rial has lost significant value against major currencies. Government debt, as a percentage of GDP, has also climbed, reflecting the challenges of financing public services under conditions of prolonged unrest.
Historically, Yemen’s economy has relied heavily on agriculture and small-scale fishing. However, conflict and disruptions to infrastructure have led to declines in agricultural output. Many farmers cannot afford modern inputs, which keeps productivity low. In response, small-scale imports of grains and other staples have risen, exacerbating troubles in the current account balance. Yemen also depends on remittances from its diaspora abroad: over 35% of households report receiving some form of remittance income, helping to cushion them against rising prices.
Foreign donor aid is central to keeping the economy afloat, funding not only emergency relief but also small projects aimed at restoring infrastructure. However, there are concerns about the sustainability of this approach. Yemen’s central bank, headquartered in Aden, struggles to maintain stable monetary policies, and confidence in the banking sector remains weak. High levels of unemployment estimated to be around 28% in 2022 partly stem from the weak investment environment and limited industrial capacity. Despite efforts to attract foreign direct investment (FDI), political risks and security costs deter many potential investors.
Poverty levels in Yemen are among the highest in the region. In 2022, approximately 66% of the population was estimated to live below the international poverty line of US$1.90 per day. Widespread malnutrition and inadequate health care underscore the severity of the crisis, creating a poverty cycle: households with low income have limited access to education and health care, leading to low productivity and thus perpetuating low income. Development groups emphasize that without significant improvements in security, infrastructure, and human capital, Yemen’s economy is unlikely to break free from this cycle.
Greece, located in Southeast Europe, has traditionally relied on tourism, shipping, and agriculture as key sectors of its economy. Following the global financial crisis, the Greek government underwent several reforms aimed at stabilizing its public finances and boosting economic growth. Although the economy shows signs of recovery, it still faces challenges in terms of high unemployment, tax revenue collection, and income inequality.
The tourism sector remains a driving force. In , tourism accounted for almost of Greece’s GDP. However, demand for hotel stays is sensitive to price changes. Agriculture also plays a significant role, with olive oil being one of Greece’s major exports.
In recent years, Greece has pursued measures to tackle tax evasion and to improve government finances. Indirect taxes (such as VAT) on many goods and services are relatively high compared to other EU countries. The government has also considered expansionary fiscal policy, hoping to capitalize on a positive Keynesian multiplier effect to stimulate growth.
Practice IB Economics Topic 4.3 Arguments for and Against Trade Protection with authentic exam-style questions for both SL and HL students. This question bank focuses on the exact syllabus content for 4.3 Arguments for and Against Trade Protection and mirrors Paper 1, 2, 3 style where relevant.
Get instant solutions, detailed explanations, and build confidence with questions aligned to IB examiner expectations.
The government has sought to promote economic diversification beyond copper by investing in agriculture, tourism, and small-scale manufacturing. Despite these efforts, poverty remains widespread: approximately of the population lives below the national poverty line, with rural areas most severely affected. To tackle this, Zambia’s government increased social spending: in , about of its total budget was allocated to improving rural infrastructure, secondary education, and healthcare services. Policymakers hope that these measures will boost productivity and reduce inequality in the long run.
One persistent challenge is maintaining macroeconomic stability in the face of high external debt and fluctuating copper prices. Inflation has hovered between and annually in the past few years. The government implemented tighter monetary policies in late , including higher reserve requirements for commercial banks, aiming to limit excess money creation and stabilize the exchange rate. In addition, Zambia entered negotiations with international financial institutions for debt restructuring, seeking to create more fiscal space for social programs.
On the microeconomic front, price floors and subsidies in the agricultural sector continue to spark debate. Maize, the country’s staple crop, has benefited from guaranteed minimum prices set by the Food Reserve Agency. Proponents argue this policy supports farmers’ incomes and food security, while critics fear inefficiencies and budgetary strains. Furthermore, access to credit remains a bottleneck for many small and medium-sized enterprises (SMEs), preventing them from scaling up and creating more job opportunities.
Zambia also participates in regional trade agreements, such as the Common Market for Eastern and Southern Africa (COMESA). Tariff reductions within the region have encouraged some diversification in exports—particularly of agricultural goods and textiles to neighboring countries. Recently, the government signed a new bilateral trade deal with Malawi and Zimbabwe to reduce non-tariff barriers, with the idea of boosting cross-border trade. Officials hope this agreement will expand the market for Zambia’s emerging non-traditional exports, such as processed foods and manufactured goods, fostering greater resilience against future commodity price shocks.
Despite these positive developments, inequality and poverty remain pressing concerns. The government estimates that about new entrants join the labor force annually, yet formal employment growth lags behind. Zambia’s human development indicators highlight the challenges: literacy rates in some rural provinces remain below , while malnutrition affects nearly of children under five. The government is therefore focusing on vocational training and improved healthcare to interrupt what development economists often refer to as the “poverty cycle,” wherein low incomes lead to low investment in human capital, perpetuating underdevelopment.
Private foreign direct investment (FDI) has recently targeted not only mining but also Zambia’s small manufacturing sector and retail services. However, uncertainty around regulatory changes and debt sustainability may temper investor confidence. If foreign investment in education and healthcare can be encouraged alongside initiatives to improve infrastructure, many economists believe Zambia has the potential to achieve more stable and inclusive growth.
Overall, Zambia’s policy mix aims to balance immediate social needs with sustainable growth. While copper exports will likely remain an important source of foreign exchange, reducing dependence on a single commodity is widely seen as essential. The combination of social programs, targeted subsidies, and deepening regional trade may help Zambia overcome enduring challenges related to poverty, volatility, and a narrow economic base.
Table 1: Zambia’s Selected Macroeconomic Indicators (2019–2022)
| Indicator | 2019 | 2020 | 2021 | 2022 |
|---|---|---|---|---|
| Real GDP Growth Rate (%) | 2.0 | -2.8 | 1.6 | 3.2 |
| Inflation Rate (%) | 12.5 | 17.5 | 19.0 | 16.3 |
| Unemployment Rate (%) | 11.0 | 12.5 | 12.8 | 11.9 |
| Government Budget Balance (% GDP) | -7.0 | -9.8 | -8.5 | -7.2 |
| Exchange Rate (ZMW per US Dollar) | 14.0 | 17.0 | 18.2 | 18.0 |
Table 2: Zambia’s Sectoral Export Composition (2022)
| Sector | Share of Total Exports (%) |
|---|---|
| Copper and Minerals | 68 |
| Agricultural Products | 15 |
| Manufactured Goods | 10 |
| Textiles | 4 |
| Tourism Services | 3 |
the term “price floor” (paragraph 4).
Using the information in the text (paragraph 5), two ways in which regional trade agreements, such as COMESA, can promote economic development in Zambia.
Although the government has been reducing fuel subsidies gradually, it still subsidizes essentials like wheat and cooking oil to mitigate social unrest. These price supports are expensive, constituting an estimated 8% of government spending in 2021. Some policymakers argue that subsidizing basic goods is vital to prevent further humanitarian crises, while others caution that rising subsidies crowd out expenditures on health care, education, and longer-term development.
In an attempt to stabilize the currency, the central bank announced a partial liberalization of exchange rates in 2020. However, black market trading of foreign currencies remains prevalent, undercutting official attempts at stabilizing the rial. International organizations, including the International Monetary Fund (IMF), have recommended structural reforms and capacity-building programs to improve public financial management and reduce corruption.
According to trade data, Yemen’s main exports limited amounts of crude oil and agricultural products like coffee have declined due to damage to infrastructure and maritime shipping routes. Import tariffs have been cut on selected basic commodities to address acute food shortages, but non-tariff barriers make it challenging for local producers to access export markets. Regional trade agreements have been proposed, yet progress is slow due to ongoing security issues.
While donor money and remittances provide short-term relief, Yemen’s long-term development hinges on a return to political stability and the rebuilding of key sectors. Experts stress that improving access to education and health care while removing barriers to private investment could help lift people out of poverty. However, this requires a consistent peace effort and substantial international support. The roadmap for Yemen’s recovery is rooted in enhancing governance, upgrading infrastructure, and stimulating human capital development to ultimately promote inclusive, sustainable growth.
Table 1: Selected Macroeconomic Indicators for Yemen (2019–2023)
| Indicator | 2019 | 2020 | 2021 | 2022 | 2023 (est.) |
|---|---|---|---|---|---|
| Real GDP (US$ billion) | 24.2 | 23.0 | 22.1 | 21.8 | 21.5 |
| Real GDP Growth Rate (%) | -2.0 | -4.5 | -3.0 | -1.5 | -1.0 |
| Inflation Rate (%) | 15 | 22 | 28 | 30 | 25 |
| Unemployment Rate (%) | 25 | 26 | 27 | 28 | 28 |
| Government Debt (% of GDP) | 60 | 65 | 68 | 70 | 72 |
| Official Exchange Rate (YER per US$) | 250 | 350 | 400 | 520 | 550 |
Table 2: Development and Social Indicators for Yemen
| Indicator | 2019 | 2020 | 2021 | 2022 | 2023 (est.) |
|---|---|---|---|---|---|
| Poverty Rate (% below US$1.90/day) | 58 | 60 | 63 | 66 | 66 |
| Life Expectancy at Birth (years) | 66 | 65.8 | 65.5 | 65.3 | 65.2 |
| Adult Literacy Rate (%) | 71 | 71 | 71.5 | 72 | 72 |
| Gini Coefficient | 0.38 | 0.40 | 0.41 | 0.41 | 0.42 |
| Average Annual Remittance Inflows (US$ bn) | 3.2 | 3.5 | 3.5 | 3.6 | 3.6 |
| Fuel Subsidies (% of Gov’t Expenditure) | 10 | 9 | 8 | 8 | 7 |
the term “poverty cycle” as indicated in the text (paragraph 4).
the term “remittances” as indicated in the text (paragraph 2).
Using information from Table 1, the percentage change in the official exchange rate (YER per US$) from 2019 to 2023.
Table 1: Selected Macroeconomic Indicators for Greece
| Year | Real GDP (billion €) | Annual Real GDP Growth (%) | Government Spending (billion €) | Gini Coefficient |
|---|---|---|---|---|
| 2018 | 185 | 1.8 | 52 | 0.34 |
| 2019 | 187 | 1.1 | 53 | 0.34 |
| 2020 | 175 | -6.4 | 57 | 0.35 |
| 2021 | 182 | 4.0 | 58 | 0.35 |
Table 2: Sample Data for the Greek Hotel Market ()
| Average Price per Night (€) | Quantity Demanded (thousands of visits) |
|---|---|
| 80 | 2700 |
| 90 | 2500 |
Assume that, between an average price of € and € per night, the percentage change in quantity demanded is and the percentage change in price is .
Table 3: Taxation in Greece
| Type of Tax | Rate of Tax |
|---|---|
| Corporate Income Tax | 22% |
| Personal Income Tax | Progressive rates from 9% to 44% |
| Standard VAT | 24% |
Figure 1: Market for Greek olive oil (hypothetical)
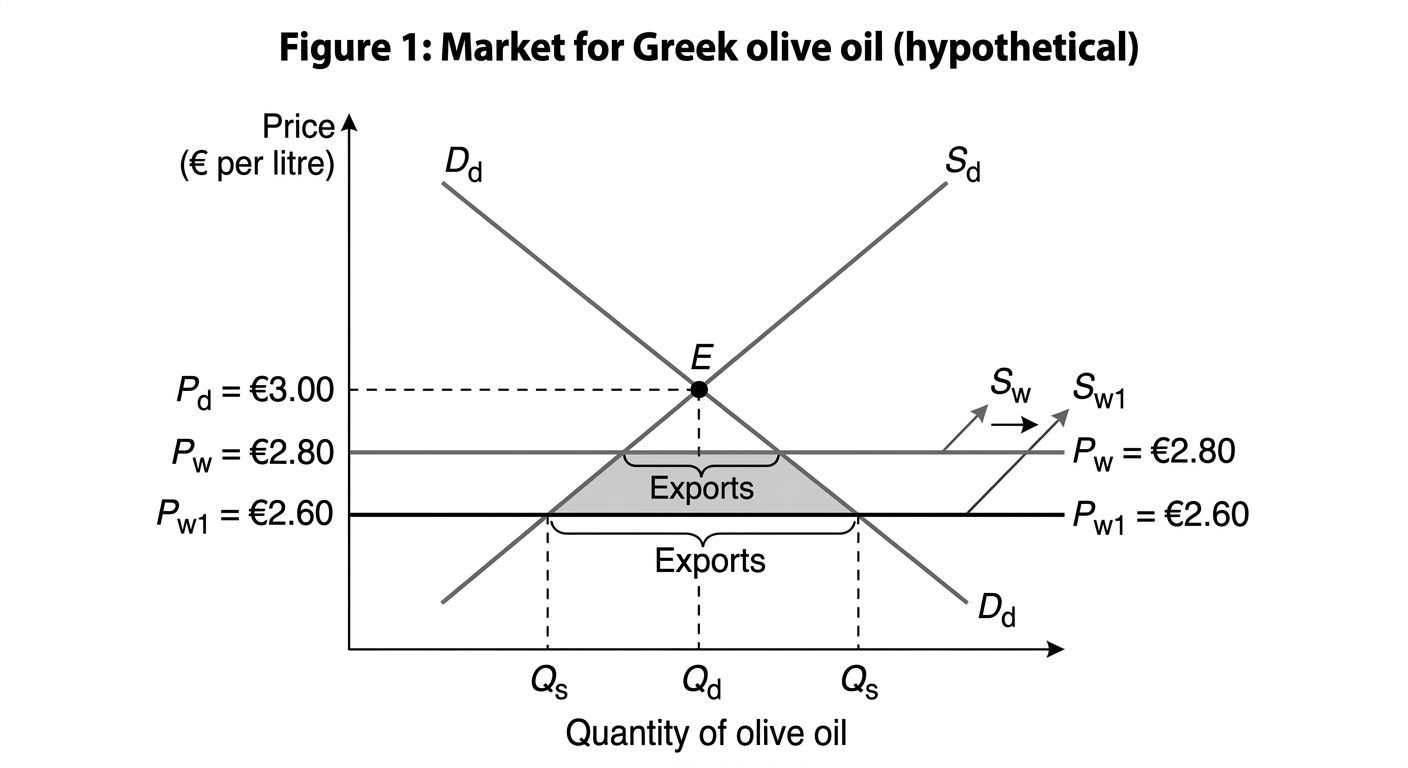
Additional information for Figure 1:
• The domestic demand curve () and domestic supply curve () intersect at € per liter. • World supply shifted from to , reducing the world price from € per liter to € per liter. • Olive oil exports increased as a result.
Using information from Table 1, the change in the annual real GDP growth rate between and (in percentage points).
